How the multi-venue dashboard works
Bookteq is proud to announce an improved dashboard, now capable of mixing and matching data from multiple venues at once! Before the introduction of the multi-venue dashboard, each venue had its own independent dashboard, even if a Bookteq account holder managed multiple venues.
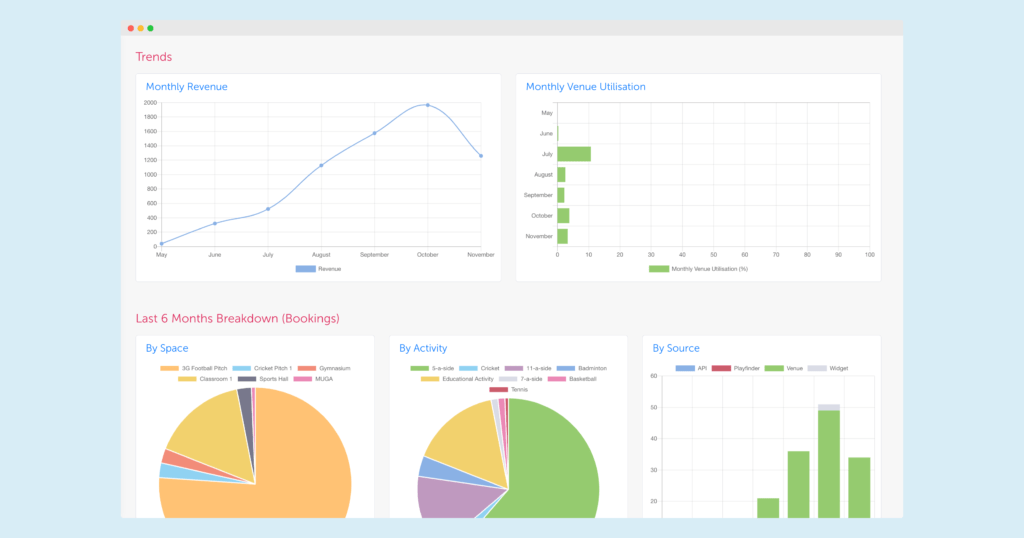
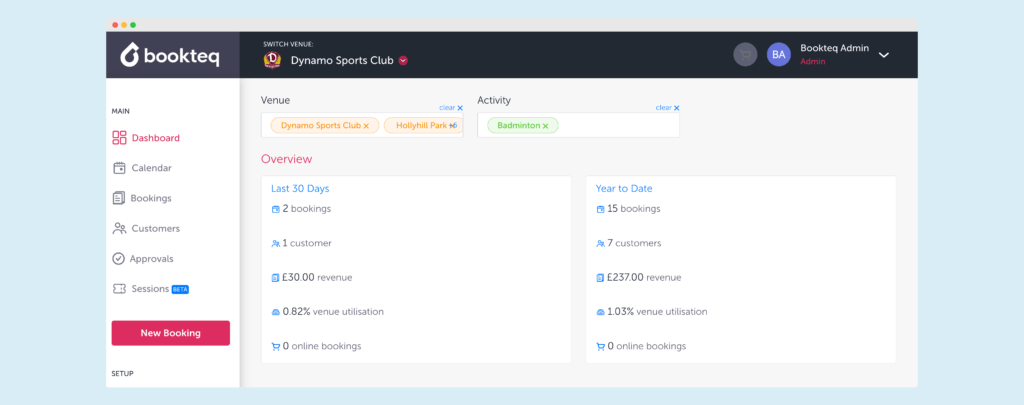
Through an assortment of line and bar graphs, tables, and pie charts, the dashboard tracks; number of bookings and customers, total revenue, venue utilisation, bookings per facility and activity type, and booking source. In addition, the new version now allows those who manage more than one venue account to generate a single report that combines the data of all, or a specific segment, of their venues.
Why is this so helpful? Well, if a Multi Academy Trust (MAT) manages bookings for ten schools, they can now see the total revenue and bookings all the schools generate in one place. This saves the MAT time, as they would previously have needed to toggle between each school’s dashboard and manually extract the data from each. In addition, if the MAT wanted to only view data from their primary schools, they could segment the data to display that and export it.
Activity Type Filter
Not only can you filter by venue, but you can also now filter data by activity type. This is particularly useful to identify trends in your organisation’s performance. For example, you can filter your dashboard to only show you the data for all your football pitches, or every activity that takes place in your sports hall(s). Depending on the data trends, this type of segmentation could help you optimise performance and prioritise areas of growth.
To see how Bookteq can help you make the most of your facilities or learn more about the dashboard, book a meeting with our team today!